John: As investors it’s so easy to get caught up in the daily news releases, blogs and movements of our investments that we sometimes lose focus on the “Big Picture”. By that I mean the indicies and sector charts which are associated with the stocks of our interest. In our case the main index is the CDNX and the sector, of course, is Gold (continuous contract). Other indexes that we need to analyze are the TSX Gold Index and of course the U.S. Dollar Index. Over the next 4 days we will be looking at each of these weekly charts to review what has happened recently and where we believe the Gold sector and these indicies are going in the near future.
We have chosen weekly charts because we are primarily interested in trend analysis. Today we start with the CDNX:
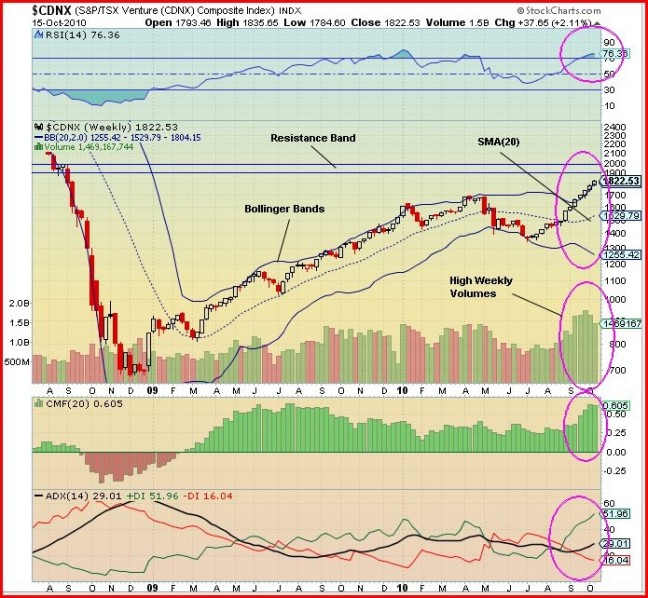
The first thing to notice about this chart is that the CDNX has only experienced one down week in the last 14 weeks. This is incredible and shows what great inherent strength there is in this index.
We have previously shown how the CDNX often leads Gold and the TSX Gold Index and how these junior and microcap Gold companies are becoming an increasing force in the area of Gold investments. The CDNX opened last week at 1793, drifted to a low of 1785, climbed as high as 1836 and then closed at 1823 for a weekly gain of 38 points (2.11%) on volume of 1.5 billion shares.
Looking at the chart we see there is a band of resistance between 1900 and 2000 (the declining 200-week moving average is also in this area) and there is no apparent resistance between the present level and 1900. The weekly SMA(20) moving average (dotted blue line) is providing strong support and is pointed up in bullish orientation. The Bollinger bands which denote volatility are getting wider, thus the volatility is increasing. The index level is consistently closing above the upper band and shows no signs of weakening. The volume remains at a high level and since the beginning of August the average weekly volume has doubled.
Looking at the indicators:
The RSI is overbought but only at 76%, so there is plenty of room for the CDNX to climb without the RSI reaching an extreme level – bullish.
The Chaikin Money Flow (CMF) indicator (green) is high at .605 (above .25 is bullish) and shows the buying pressure remains high – bullish.
The ADX trend indicator has the +DI (green line) above the -DI (red line) and at the 52 level, climbing and showing no signs of weakening. The ADX trend strength indicator (black line) shows the trend strength at 29 and climbing, thus getting stronger. The +DI crossed above the -DI in mid-August and that is when the bullish trend really started to kick in. All ADX indicators are in bullish orientation.
Outlook: We fully expect the CDNX to continue its bullish advance to at least the 1900 level where it will encounter some resistance. As we’ve stated before, this is a bull market of historic proportions. The CDNX may pause or correct somewhat after a move into the 1900-2000 area, but over the coming months we see a high probability of a very strong push well beyond 2000.

