This past summer, based on technical patterns we were seeing in the CDNX and Gold, BMR pointed out the strong possibility that the CDNX could at least double in value from its July low of 1343 to around 2700 by late winter or early spring of next year, essentially duplicating what the Nasdaq did between the summer of 1999 and March of 2000. We’re not suggesting the CDNX is in a dot com-style “bubble” right now because that just isn’t the case. We just wanted our readers to start thinking “BIG” because of the near-term potential we were seeing with the CDNX.
Indeed it appears increasingly evident that the CDNX is about to pull off a 1999-2000 Nasdaq-style move within a nine-month period. At the moment the CDNX is underpinned by rock-solid technical support between 1900 and 2000, and a move to 2700 from current levels by the end of March represents another major advance of 35% in just four-and-a-half months. One can also not rule out new all-time highs in the CDNX by sometime in 2011 – all things are possible as this Commodities Super Cycle intensifies. The Perfect Storm is in place. Below, John compares the current CDNX with the Nasdaq boom of 1999-2000 in more detail:
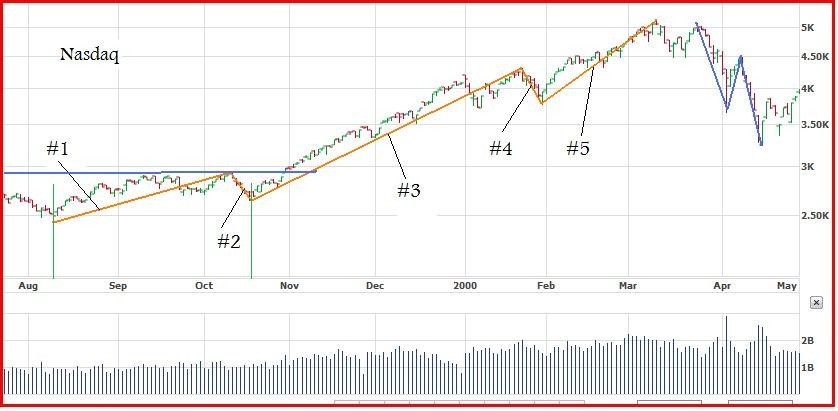
John: In July we compared the CDNX chart for 2004 with the CDNX chart for 2010 and found that the 2010 chart was basically a repeat of the 2004 chart. We were not surprised by this as Technical Analysis is based on the premise that chart patterns are repetitive. Today we are going to compare the Nasdaq chart for the period of August, 1999, to May, 2000, with the CDNX from mid-May of this year to the present. Hopefully this will give us additional insight into the intermediate term trading patterns of the CDNX. First let us look at the 9 month NASDAQ chart:
We start at the low at 2500 during the 2nd week of August, 1999, and over a period of 2 months the Index climbed to nearly the 3000 level at which point it retraced to 2700. These 2 moves are noted on the chart as #1 and #2 respectively. Then from mid-October to the 3rd week in January, 2000, there was a steady climb to about the 4400 level. This is noted as #3 on the chart. Then the Index retraced to 3800 until the beginning of February from where it climbed to 5100 during the 2nd week of March. These moves are noted as #4 and #5 respectively. The result is that from the 2nd week of August, 1999, to the 2nd week of March, 2000, a period of 7 months, the Nasdaq gained over 100%. As we have shown on the chart this move was made in 5 waves (orange) in accordance with Elliott Wave Theory which states that every Motive Phase, bullish or bearish, consists of 5 distinct waves and if the Primary trend is still in place it will be followed by a 3 wave Corrective Phase (shown in blue).
Now let’s took a look at the CDNX:
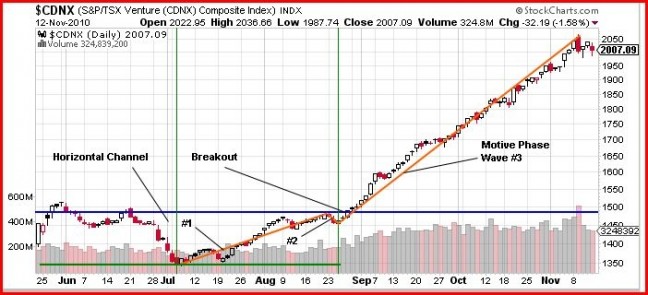
Looking at the 6-month daily CDNX chart for the period from mid-June, 2010, to mid-November, we see that the low for this period occurred during the 1st week of July at 1343 and then the Index proceeded to climb to a high of approximately 1480 on August 23rd. From there a small retracement occurred down to 1440 on September 1. These 2 waves are noted as #1 and #2 respectively. The chart shows the trading to this point was in a horizontal trend channel.
During the first week of September the Index broke out of this channel to the upside and has continued to climb to the present time. This last move is noted as wave #3. This wave has been in effect for nearly 3 months and there is no clear indication that this is the end. In the case of the Nasdaq, wave #3 lasted for approximately 3.5 months before the start of wave #4.
In Elliott Wave Theory, wave#3 is never the shortest wave and often is the longest.
Outlook: We can clearly see that the CDNX is following the Nasdaq chart quite closely and is definitely in a 5-wave Bullish Motive Phase. If the CDNX time factor to the end of wave #5 equals that of the Nasdaq chart, we could see the end of wave #5 sometime in February, 2011. But with the strength presently being displayed by the CDNX, this Motive Phase could easily be extended into March or beyond. We will see.


1 Comment
Interesting news for Archean Star today. Go to Market Wire website…