Gold dipped as low as $1,588 overnight but is trading at $1,595, a gain of $2 for the day, as of 7:00 am Pacific…Gold rose yesterday after European Central Bank council member and head of Germany’s Bundesbank, Jens Weidmann, said the ECB will maintain its accommodative monetary-policy stance “for as long as necessary”…Silver is up 6 cents at $29.21…Copper is off a penny at $3.53…Crude Oil is up 64 cents to $93.18 while the U.S. Dollar Index has is up nearly half a point at 82.96…
Silver is starting to receive more attention by market participants, supported by “moderately bullish” fundamentals, says HSBC…the bank cites a Bloomberg story that China’s Silver fabrication demand from electronics manufacturing represents 18% of the global total, and almost 9% of overall Silver demand, split between the manufacturing of computers and semiconductors…”With more than half of total Silver demand going to manufacturing applications and processes, the bulk of which is consumed by the electrical and electronics industries, we believe this is likely to mean strong Silver demand with a commensurate impact on prices,” HSBC stated…the bank also cites strong Silver coin demand, citing record sales by the U.S. Mint in February…”The sales surge may be attributed to opportunistic buyers amidst lower Silver prices or willingness to own the metal as global industrial production gradually improves,” HSBC stated…
U.S. Retail Sales Jump More Than Expected
Retail sales rose more than expected in February as Americans bought motor vehicles and a range of other goods even as they paid more for gasoline, suggesting consumer spending this quarter will hold up despite higher taxes…the Commerce Department reported this morning that retail sales increased 1.1%, the largest rise since September, after a revised 0.2% in January…economists polled by Reuters had expected retail sales, which account for about 30% of consumer spending, to rise 0.5% last month after a previously reported 0.1% gain in January…
Today’s Equity Markets
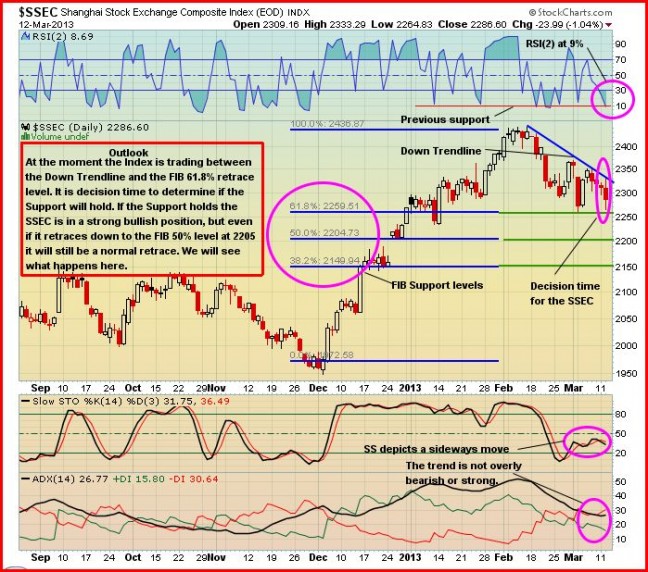
Asian markets were lower overnight with China’s Shanghai Composite falling 23 points to 2264…the red-hot Nikkei slipped 75 points to 12240…Nikkei losses were limited by expectations of aggressive monetary easing when a new Bank of Japan governor takes over next month…news that Japan’s main opposition Democratic Party has decided to back Haruhiko Kuroda, a long-time advocate of money printing and the government’s nominee for the central bank’s top post, cemented investor expectations that radical stimulus is coming soon…European markets are mildly lower today…Italy’s 3-year borrowing costs rose to their highest level since December which encouraged profit-taking…the Dow is off 18 points at 14432 through the first 30 minutes of trading…it closed at a record high for the sixth consecutive session yesterday, though the Nasdaq suffered its biggest loss in two weeks…the TSX has given up 79 points while the Venture Exchange is down 2 points at 1117…
Shanghai Composite Updated Chart
We noted in December that China’s Shanghai Composite had broken out above a 2-year downtrend line, a positive development for global equities in general though the Venture Exchange continues to struggle…the Shanghai had a powerful December and January, climbing several hundred points, before starting what appears to be a normal correction in February…the evidence suggests that this pullback has nearly run its course with strong Fibonacci support between 2150 and 2250 (the Composite closed at 2264 today) as John’s 6-month daily chart shows below…it would be a positive sign if the Shanghai is able to hold this important support…history shows that the Shanghai and the Venture Exchange, two very speculative markets, tend to follow the same general trend though the Venture typically lags a little bit…
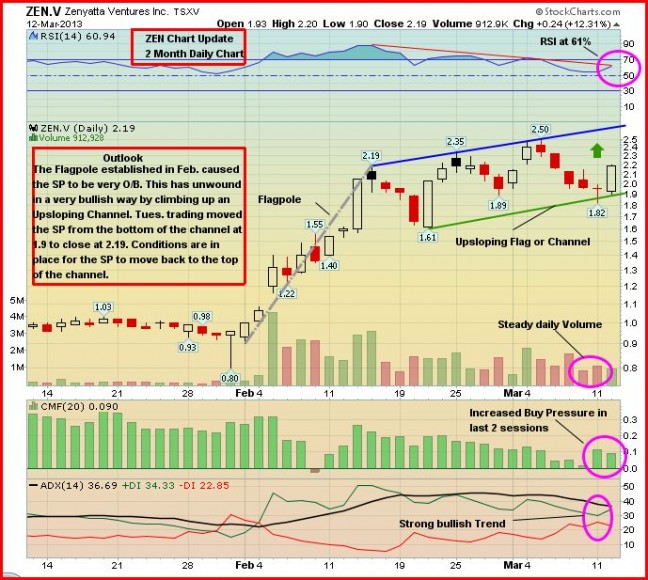
Zenyatta Ventures Ltd. (ZEN, TSX-V) Updated Chart
Crude Oil – Where To From Here?
One Oil industry expert, the CEO of Australian-based commodities trading firm Compass Global Markets, gave a very bold and bearish forecast for WTI on CNBC’s “Asia Squawk Box” yesterday…Andrew Su predicts WTI will drop nearly 20% to around $75 a barrel during the upcoming second quarter and even further beyond that…”Shale Oil is the reason why Oil prices fell last year and the reason why it will continue to fall in the next few years,” said Su…”Shale Oil will reshape the way that the entire Oil industry is run and the U.S. will become an exporter of Oil in the next five to 10 years…that will have a significant impact on the U.S. and the global economy,” he added…
Oil demand in the U.S. last year fell to its lowest level in 16 years, down 2% compared to 2011 levels, the International Energy Agency reported at the end of February…the decline in consumption was blamed on the weak economy, high unemployment, growing vehicle efficiency and high fuel prices…meanwhile, the U.S. Energy Information Administration yesterday cut its 2013 forecast for WTI in its monthly Short-Term Energy Outlook…Crude will average $91.92 this year, down from a February estimate of $92.81, according to the Energy Department’s statistical unit…
Keep in mind that significantly lower Oil prices, if this were to occur, would be bullish for Gold producers as Oil is such an important component in their cost structures…
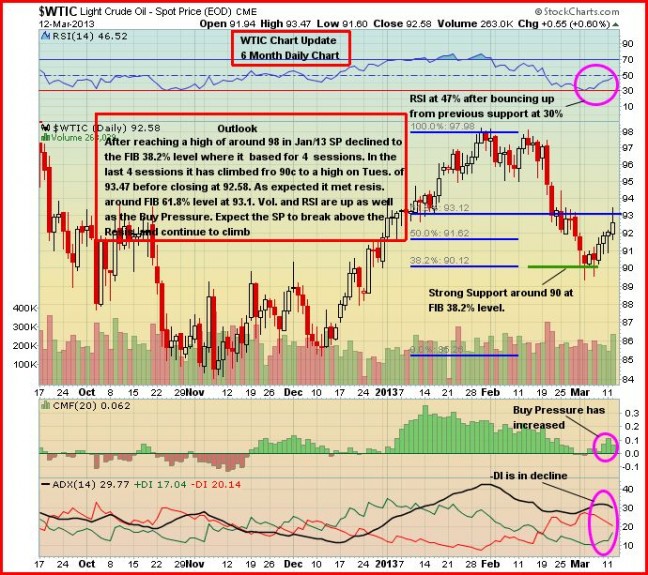
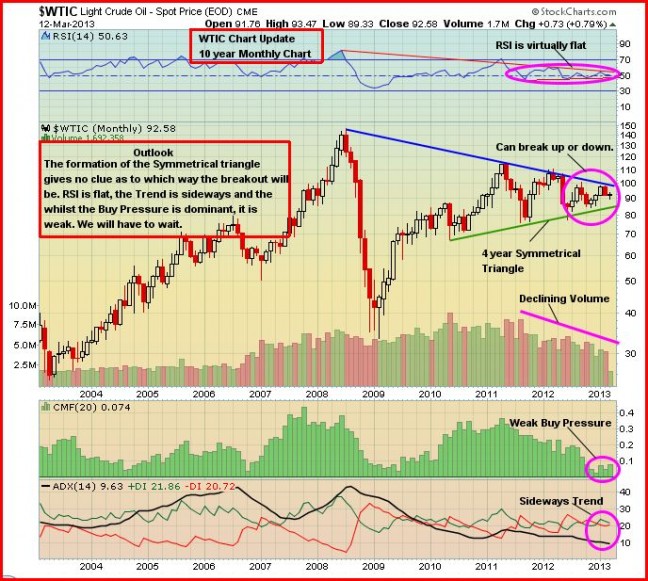
Below are two WTI charts from John…the first one is 6-month daily chart that shows how WTI became technically overbought in January as it rallied from its November-December lows and approached the $100 level…strong support exists around $90 (the 200-day SMA is $90.38) while near-term resistance is at $93…the long-term chart below the 6-month chart is interesting in that it shows Crude is trading in a 4-year symmetrical triangle with “decision time” nearing…it could break either way, up or down – so a fall to $75 certainly can’t be ruled out…
WTI 6-Month Daily Chart
WTI Long-Term Chart
Note: John, Jon and Terry do not hold share positions in ZEN.


